Cross-module
13 dimensions, one engine.
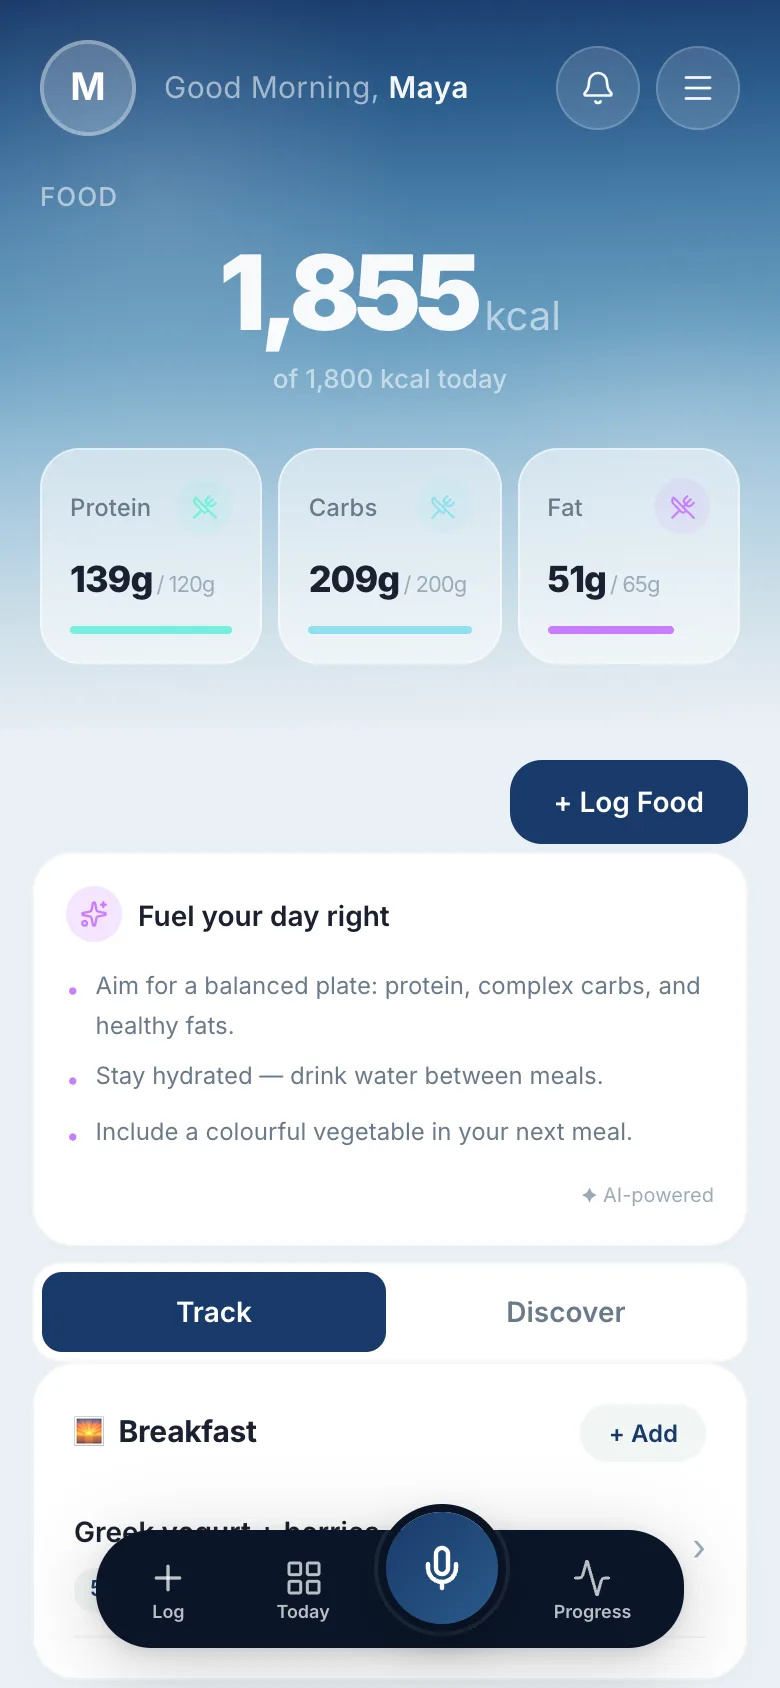
Sleep, food, mood, exercise, cycle, meds, water, steps, fasting — tr8ck looks at all of them at once. No other app does.
Plain English
No HRV percentiles.
tr8ck does not say "RMSSD declining." tr8ck says "you slept badly because of last night's pasta." Big difference.
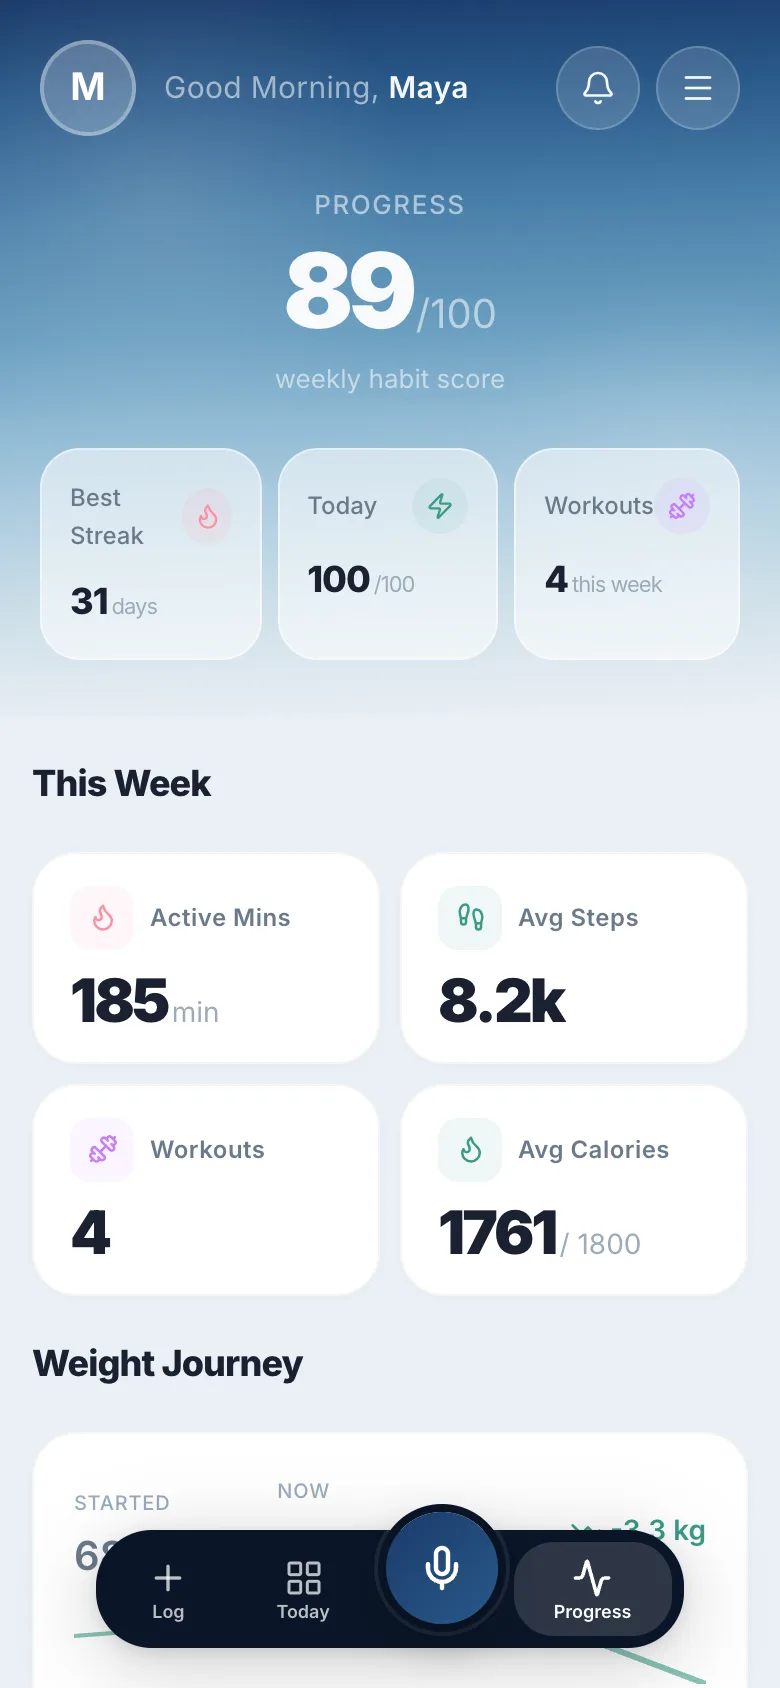
Personal, not generic
Your patterns, not the averages.
Health Twitter says 8 hours sleep, 10K steps, 3L water. tr8ck shows what actually works for you, in your data.
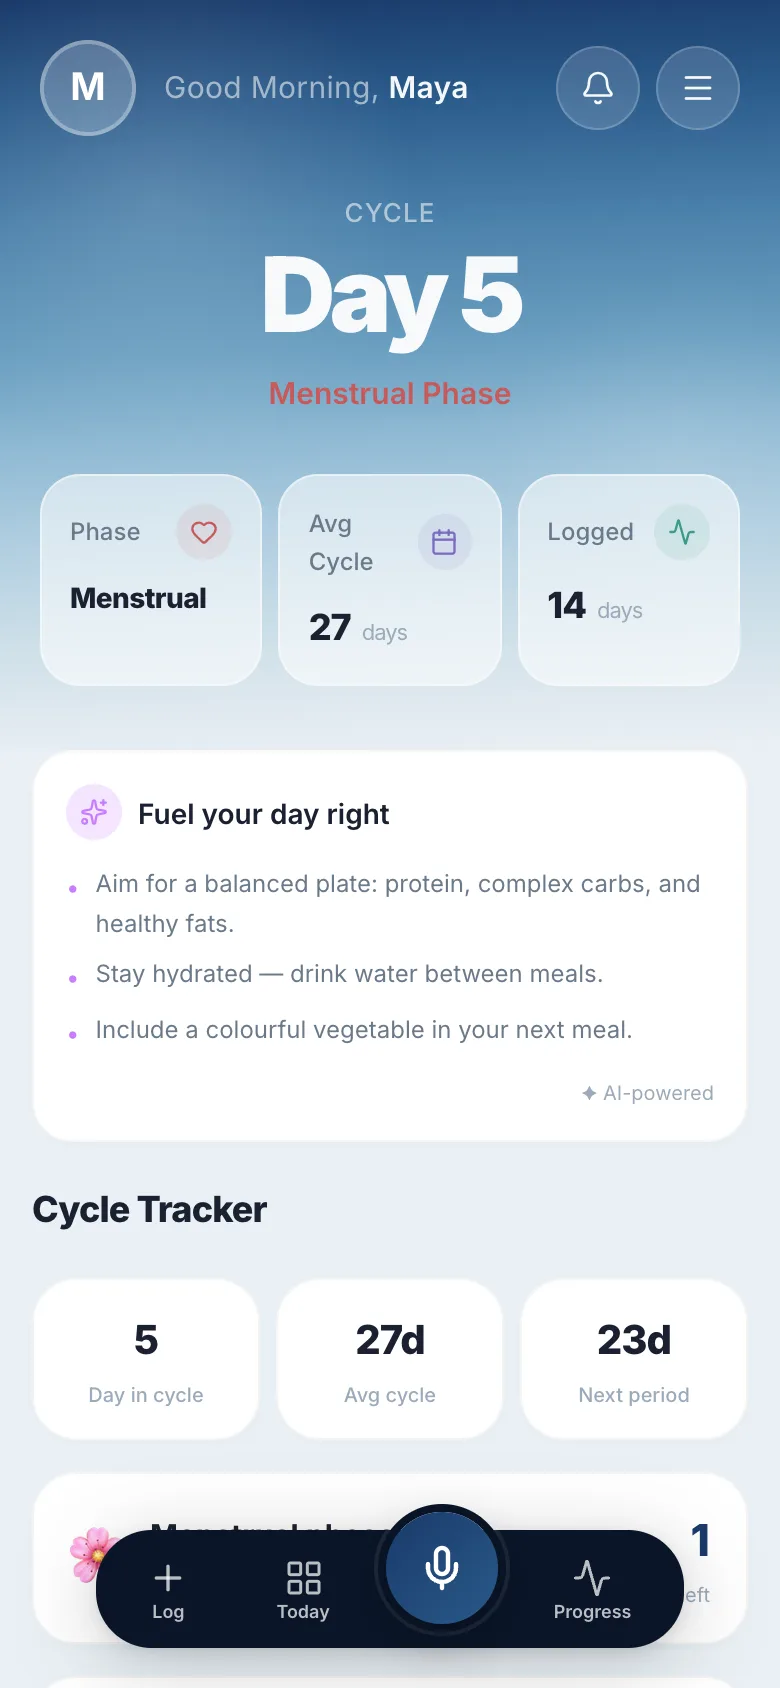
Cycle-aware
Adapts to your phase.
Same input, different week, different answer. tr8ck adapts insights to where you are in your cycle.
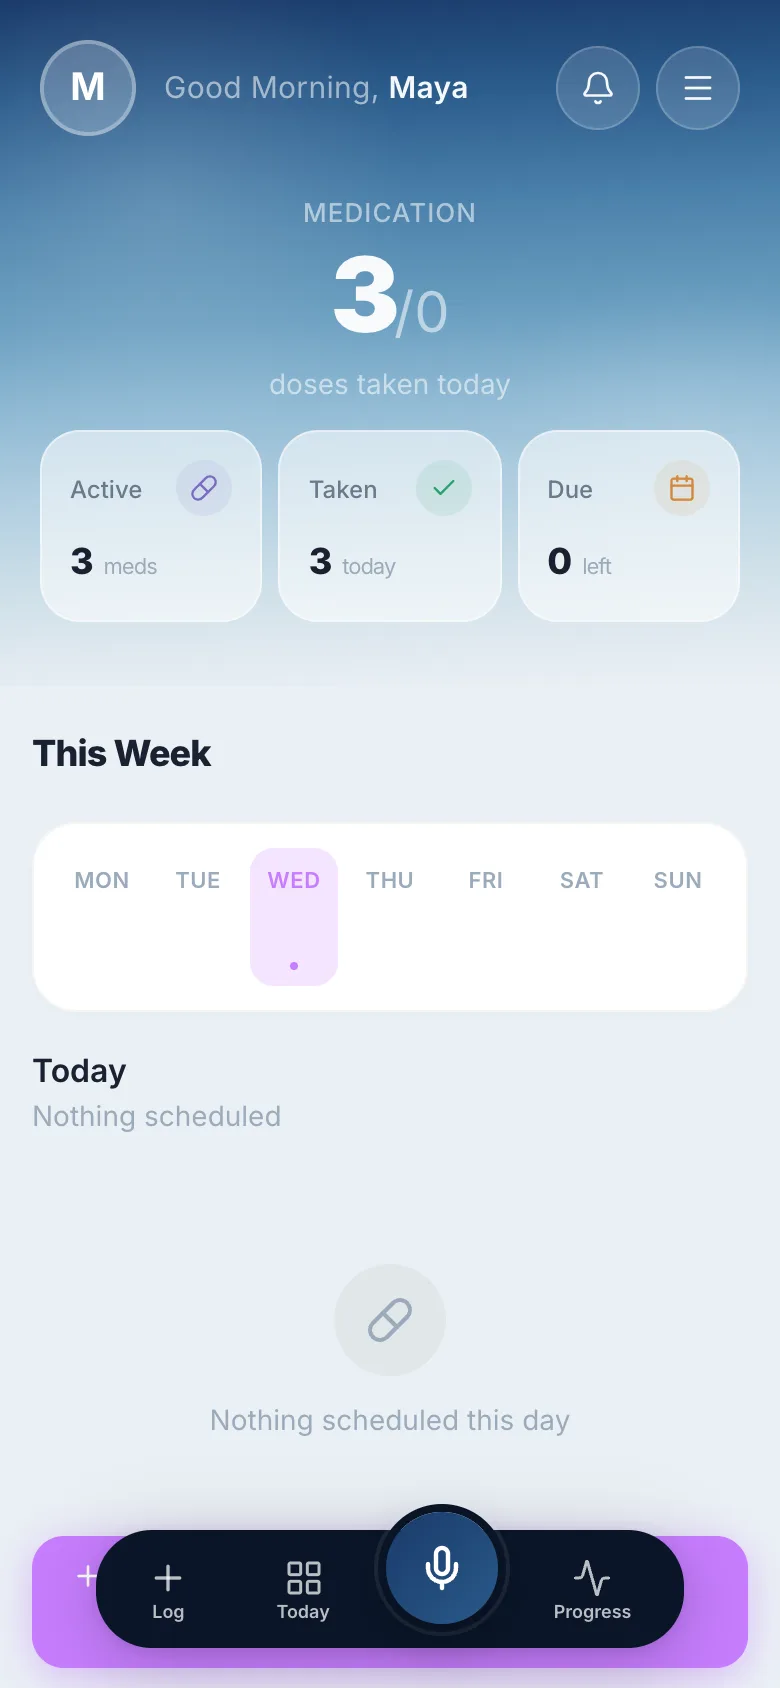
GLP-1 aware
Knows your meds change everything.
On Ozempic? Wegovy? Mounjaro? tr8ck factors in medication timing and dose to every insight.
60 seconds, not 60 days
First insight in 7 days.
Most apps need a year of data. tr8ck gives you a real, actionable answer within a week.